
Why this score
moderately fillingLow energy density — a lot of food for the calories.
Three routes to fullness — one is enough
11% of kcal
87% water
0 g/Mcal
What pulls it down
35%
3%
Per
- Calories
- 480
- Protein
- (11%)
- 13 g
- Fat
- (39%)
- 21 g
- Carbohydrates
- (50%)
- 61 g
- of which sugar
- 58 g
- Fiber
- 0 g
- Sodium
- 310 mg
Percentages are the share of calories from each macronutrient.
Alternatives
StarbucksHigher-scoring, from Starbucks’ own “Trending” in Canada.
 65Iced Brown Sugar Oat Shaken Espresso1–3 g protein · 100–200 cals · 3 sizes
- Pecan Crunch Latte6–14 g protein · 132–330 cals · 4 sizes
 61
61 - 49Cool Lime Refresher0–0.1 g protein · 60–150 cals · 4 sizes
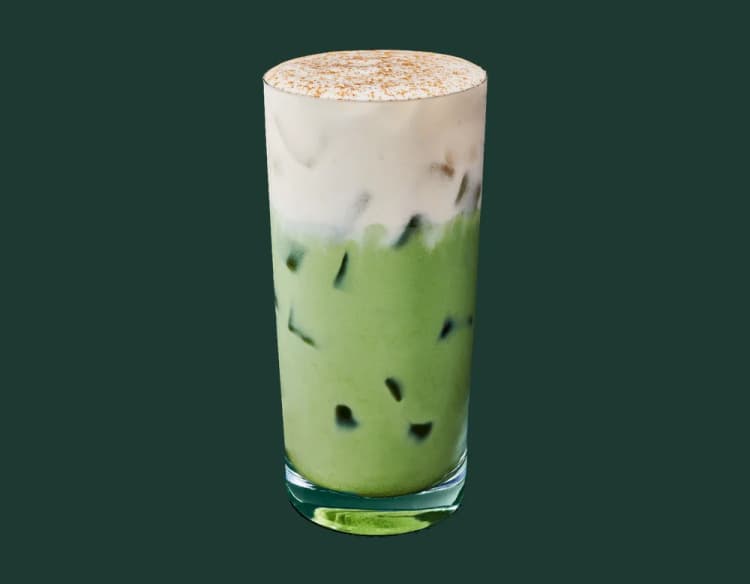 46Iced Banana Bread Matcha (Venti)12 g protein · 430 cals · 709 ml
- 46Iced Chaider0.1–0.3 g protein · 65–163 cals · 4 sizes
Nutrition as published by Starbucks — check it yourself. The score measures satiety per calorie. It is not a virtue scale, and no food here is forbidden. How the score works.