Snack mix
0
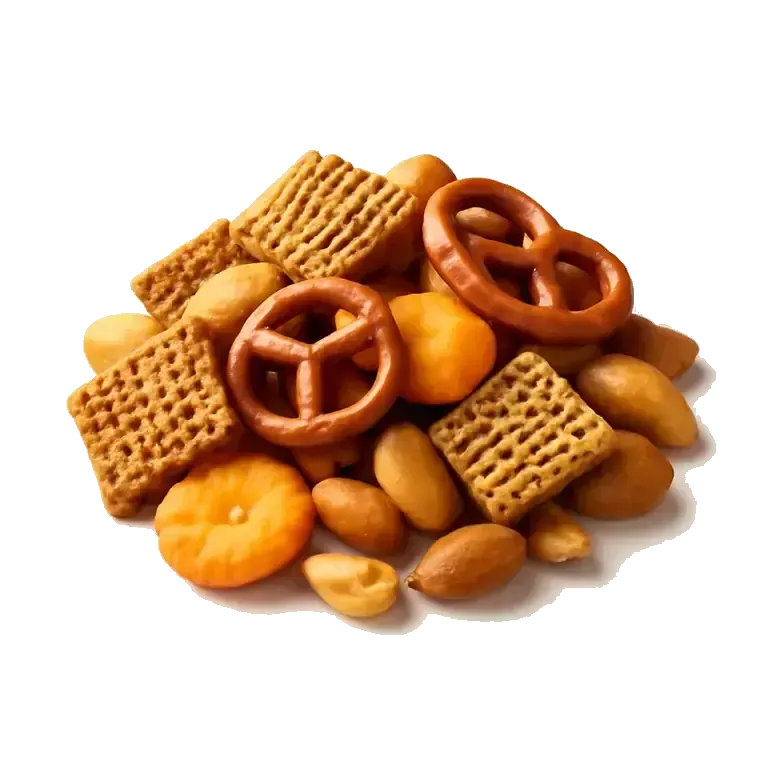
as eaten · per 100 g: 504 kcal · 6.9 g protein · 3.1 g fiber
satiety per calorie · 0–100 · not a virtue scale
Why this score
engineered against fullnessFat and refined carbohydrate converging the way engineered food does; dense calories with little protein, volume or fiber to fill you up.
Three routes to fullness — one is enough
5% of kcal
2% water
6 g/Mcal
What pulls it down
2%
77%
Per
- Calories
- 504
- Protein
- (5%)
- 7 g
- Fat
- (45%)
- 26 g
- Carbohydrates
- (49%)
- 63 g
- of which sugar
- 2 g
- Fiber
- 3 g
- Sodium
- 729 mg
Percentages are the share of calories from each macronutrient.
Better in this aisle
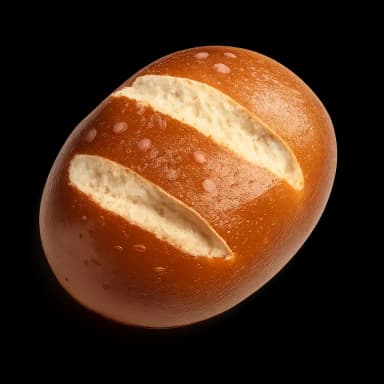
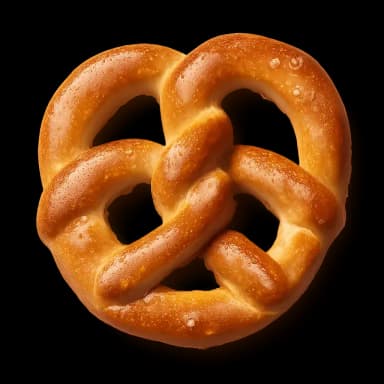
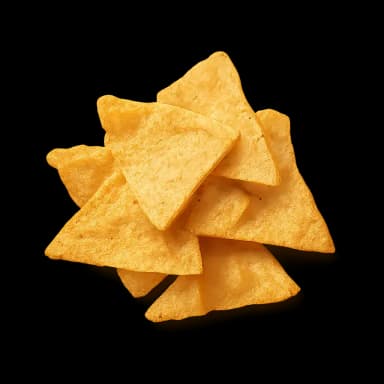
Salty snacksHigher-scoring salty snacks, ranked by fullness per calorie.

Compare Snack mix with another food
Per 100 g. Source: usda-survey-fndds #2708213. Every number is traceable, every score recomputable. The score measures satiety per calorie. It is not a virtue scale, and no food here is forbidden. How the score works.